Maps
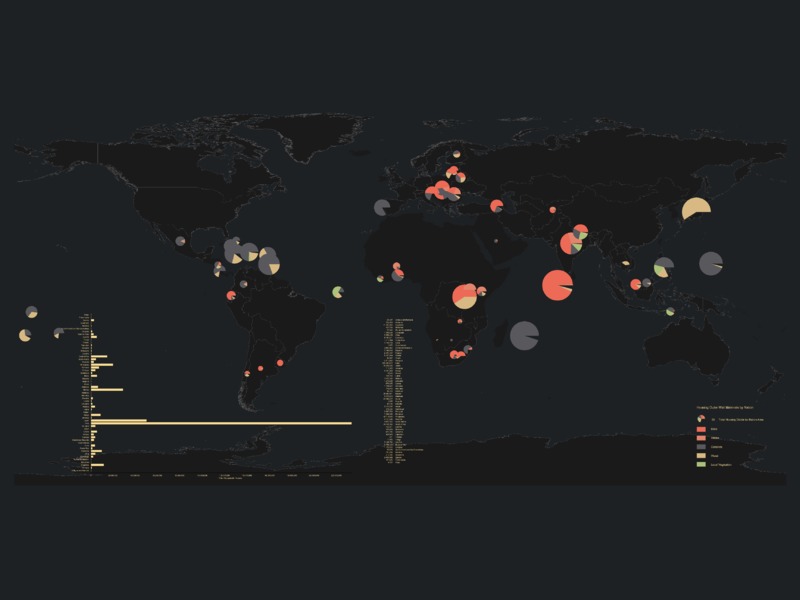
This map illustrated the significant materials are used for the occupiable residential exterior wall. The size of the pie diagram shows the total number of valid cases divided by the nation's area. Different color represented the percentage of materials applied to the nation. All the data comes from the United Nations open data resource. One thing to notice is this data set does not contain all the countries of the world.
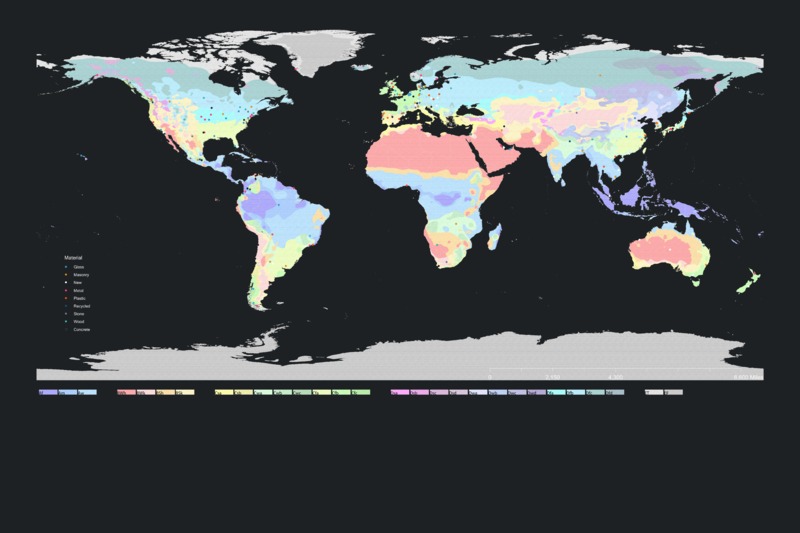
This map shows where are all the case studies (including all the cases from in exhibition) located based on the Köppen climate classification. Different color dots represent the material of interest of that particular case study.
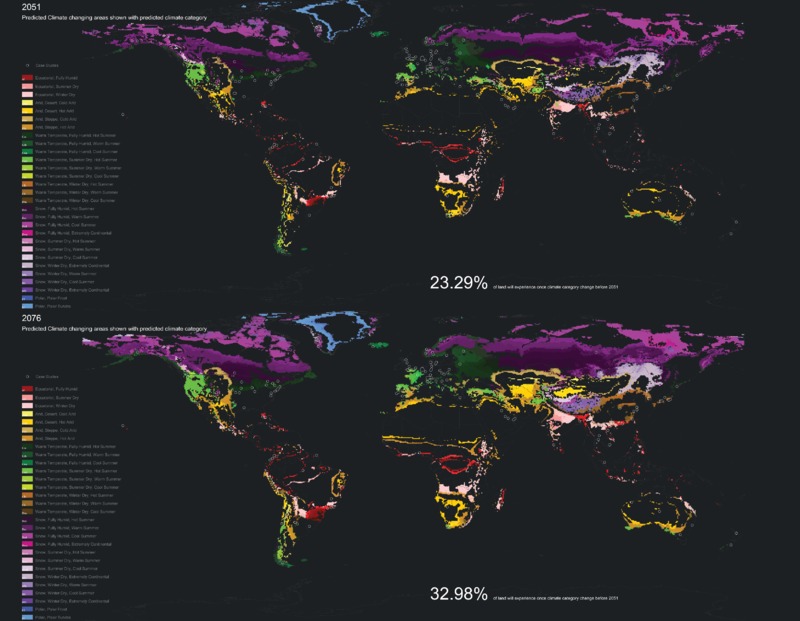
These two maps highlighted the area which will experience at least once of climate category change combined of four different prediction methods. The highlighted area shows the climate category the area is changing to in the future. The data used for analysis comes from the website of World Maps of Köppen-Geiger climate classification.


